import sysimport pandas as pdimport numpy as npimport reprint(f"pandas version {pd.__version__}")print(f"numpy version {np.__version__}")print("\n".join(f"Python {sys.version}".split("|")))
pandas version 2.1.1
numpy version 1.24.3
Python 3.11.5 (main, Sep 11 2023, 13:54:46) [GCC 11.2.0]
A comment on file formats
The most common simple format for tabular data is comma separated or tab separated (csv or tsv).
Newer formats such as arrow and parquet are more efficient in storage and faster to load.
Pandas 2.0 can handle these newer formats.
Reading a dataframe
# read from a csv filepenguins = pd.read_csv("data/penguins-raw.csv")# read from a url# url = "https://raw.githubusercontent.com/mcnakhaee/palmerpenguins/master/palmerpenguins/data/penguins-raw.csv"# penguins = pd.read_csv(url)# read from an excel file# penguins = pd.read_excel('file.xlsx')rows, cols = penguins.shapeprint(f"Rows: {rows}, Columns: {cols}")print(f"Columns:", "\n".join(penguins.columns))
Rows: 344, Columns: 17
Columns: studyName
Sample Number
Species
Region
Island
Stage
Individual ID
Clutch Completion
Date Egg
Culmen Length (mm)
Culmen Depth (mm)
Flipper Length (mm)
Body Mass (g)
Sex
Delta 15 N (o/oo)
Delta 13 C (o/oo)
Comments
Series
Each column of a dataframe is a series accessed by name.
simpler = penguins[['Species', 'Body Mass (g)', 'Flipper Length (mm)']]simpler.head()
Species
Body Mass (g)
Flipper Length (mm)
0
Adelie Penguin (Pygoscelis adeliae)
3750.0
181.0
1
Adelie Penguin (Pygoscelis adeliae)
3800.0
186.0
2
Adelie Penguin (Pygoscelis adeliae)
3250.0
195.0
3
Adelie Penguin (Pygoscelis adeliae)
NaN
NaN
4
Adelie Penguin (Pygoscelis adeliae)
3450.0
193.0
Index
A dataframe has an index, which can be just the numbers from 0 to N as in this case.
penguins.index
RangeIndex(start=0, stop=344, step=1)
Columns and Rows
loc allows you to access individual elements.
# The 23rd rowpenguins.loc[23,:]
studyName                                          PAL0708
Sample Number                                           24
Species                Adelie Penguin (Pygoscelis adeliae)
Region                                              Anvers
Island                                              Biscoe
Stage                                   Adult, 1 Egg Stage
Individual ID                                        N12A2
Clutch Completion                                      Yes
Date Egg                                        2007-11-12
Culmen Length (mm)                                    38.2
Culmen Depth (mm)                                     18.1
Flipper Length (mm)                                  185.0
Body Mass (g)                                       3950.0
Sex                                                   MALE
Delta 15 N (o/oo)                                  8.43423
Delta 13 C (o/oo)                                -25.22664
Comments                                               NaN
Name: 23, dtype: object
penguins.loc[23,'Culmen Length (mm)']
38.2
penguins.loc[23:28,['Sex','Date Egg']]
Sex
Date Egg
23
MALE
2007-11-12
24
MALE
2007-11-10
25
FEMALE
2007-11-10
26
MALE
2007-11-12
27
FEMALE
2007-11-12
28
FEMALE
2007-11-10
Filtering
Filtering is done by using a boolean series as an index.
An alternative syntax is to use query. The quoting rules here can be tricky. The query is a string, and column names are set off by backticks. Using two different types of quotes allows the query to include a string.
penguins[penguins["Flipper Length (mm)"]>penguins["Body Mass (g)"]/20]
studyName
Sample Number
Species
Region
Island
Stage
Individual ID
Clutch Completion
Date Egg
Culmen Length (mm)
Culmen Depth (mm)
Flipper Length (mm)
Body Mass (g)
Sex
Delta 15 N (o/oo)
Delta 13 C (o/oo)
Comments
2
PAL0708
3
Adelie Penguin (Pygoscelis adeliae)
Anvers
Torgersen
Adult, 1 Egg Stage
N2A1
Yes
2007-11-16
40.3
18.0
195.0
3250.0
FEMALE
8.36821
-25.33302
NaN
4
PAL0708
5
Adelie Penguin (Pygoscelis adeliae)
Anvers
Torgersen
Adult, 1 Egg Stage
N3A1
Yes
2007-11-16
36.7
19.3
193.0
3450.0
FEMALE
8.76651
-25.32426
NaN
5
PAL0708
6
Adelie Penguin (Pygoscelis adeliae)
Anvers
Torgersen
Adult, 1 Egg Stage
N3A2
Yes
2007-11-16
39.3
20.6
190.0
3650.0
MALE
8.66496
-25.29805
NaN
8
PAL0708
9
Adelie Penguin (Pygoscelis adeliae)
Anvers
Torgersen
Adult, 1 Egg Stage
N5A1
Yes
2007-11-09
34.1
18.1
193.0
3475.0
NaN
NaN
NaN
No blood sample obtained.
10
PAL0708
11
Adelie Penguin (Pygoscelis adeliae)
Anvers
Torgersen
Adult, 1 Egg Stage
N6A1
Yes
2007-11-09
37.8
17.1
186.0
3300.0
NaN
8.63243
-25.21315
No blood sample obtained for sexing.
...
...
...
...
...
...
...
...
...
...
...
...
...
...
...
...
...
...
339
PAL0910
64
Chinstrap penguin (Pygoscelis antarctica)
Anvers
Dream
Adult, 1 Egg Stage
N98A2
Yes
2009-11-19
55.8
19.8
207.0
4000.0
MALE
9.70465
-24.53494
NaN
340
PAL0910
65
Chinstrap penguin (Pygoscelis antarctica)
Anvers
Dream
Adult, 1 Egg Stage
N99A1
No
2009-11-21
43.5
18.1
202.0
3400.0
FEMALE
9.37608
-24.40753
Nest never observed with full clutch.
341
PAL0910
66
Chinstrap penguin (Pygoscelis antarctica)
Anvers
Dream
Adult, 1 Egg Stage
N99A2
No
2009-11-21
49.6
18.2
193.0
3775.0
MALE
9.46180
-24.70615
Nest never observed with full clutch.
342
PAL0910
67
Chinstrap penguin (Pygoscelis antarctica)
Anvers
Dream
Adult, 1 Egg Stage
N100A1
Yes
2009-11-21
50.8
19.0
210.0
4100.0
MALE
9.98044
-24.68741
NaN
343
PAL0910
68
Chinstrap penguin (Pygoscelis antarctica)
Anvers
Dream
Adult, 1 Egg Stage
N100A2
Yes
2009-11-21
50.2
18.7
198.0
3775.0
FEMALE
9.39305
-24.25255
NaN
147 rows × 17 columns
Missing values
Dealing with missing values is a central problem in data science. One way to identify how many misssing values are out there is as follows:
## Uses the fact that logical True counts as one, False as zero## sum() method sums by columnspenguins.isna().sum()
studyName                0
Sample Number            0
Species                  0
Region                   0
Island                   0
Stage                    0
Individual ID            0
Clutch Completion        0
Date Egg                 0
Culmen Length (mm)       2
Culmen Depth (mm)        2
Flipper Length (mm)      2
Body Mass (g)            2
Sex                     11
Delta 15 N (o/oo)       14
Delta 13 C (o/oo)       13
Comments               290
dtype: int64
Nearly all of the comments are empty. What are they?
Comments
Nest never observed with full clutch.                                   34
Not enough blood for isotopes.                                           7
Sexing primers did not amplify.                                          4
No blood sample obtained.                                                2
No blood sample obtained for sexing.                                     2
Adult not sampled.                                                       1
Nest never observed with full clutch. Not enough blood for isotopes.     1
Sexing primers did not amplify. Not enough blood for isotopes.           1
Adult not sampled. Nest never observed with full clutch.                 1
No delta15N data received from lab.                                      1
Name: count, dtype: int64
Let’s save the comments separately and look at the rest.
# drop normally drops rows, but with axis=1 it drops columnspenguins = penguins.drop('Comments',axis=1)
Various options: - drop rows with missing values - impute the missing values somehow
Drop rows with missing values
# This makes a boolean where a row is True provided at least one of its entries are NAna_rows = (penguins.isna().any(axis=1))print(f"{na_rows.sum()} rows have NA somewhere outside of comments")
20 rows have NA somewhere outside of comments
# here we keep rows only if no NA's. Can also use notna().penguins_nona = penguins.loc[~na_rows,:]
Imputation
We saw above that culmen length has 2 missing values. We can use fillna to replace the missing values with something (like the mean or median or zero).
# using equality w/o copy creates another reference.penguins_imputed = penguins.copy()culmen_mean = penguins_imputed['Culmen Length (mm)'].mean() # how does this handle NA values?print(f"Culmen length mean is {culmen_mean}")penguins_imputed['Culmen Length (mm)'] = penguins_imputed['Culmen Length (mm)'].fillna(culmen_mean)
Culmen length mean is 43.9219298245614
There are many other imputation methods. For example, if the data is ordered, you can fill missing data with linear interpolation. (See the interpolate method).
Data types
As we saw above, the types of the columns are inferred when the data is read. But it’s not always correct. For example, the “Date Egg” column is supposed to be a date but it’s shown as a generic python object.
Using the correct type can greatly improve performance as generic Python arguments are inefficient.
In pandas 1.0 strings are always treated as objects but in pandas 2.0 there is a StringDtype.
The most common types are: - object - float64 - datetime (datetime64[ns]) - int64 - bool
One may also find categorical types.
penguins.dtypes
studyName               object
Sample Number            int64
Species                 object
Region                  object
Island                  object
Stage                   object
Individual ID           object
Clutch Completion       object
Date Egg                object
Culmen Length (mm)     float64
Culmen Depth (mm)      float64
Flipper Length (mm)    float64
Body Mass (g)          float64
Sex                     object
Delta 15 N (o/oo)      float64
Delta 13 C (o/oo)      float64
dtype: object
Setting datatypes
Here’s an example where we manually make sex a categorical type.
penguins['Body Mass (kg)'] = penguins['Body Mass (g)']/1000
Sorting
penguins_small = penguins[['Species','Island','Body Mass (g)']]penguins_small.sort_values('Body Mass (g)')# ascending = False for descending order# na_position = 'first' or 'last' (default is 'last')# can also provide a key which is a function of prototype Series -> Series# inplace = True doesn't return a new dataframe, sorts the given one in place
Species
Island
Body Mass (g)
314
Chinstrap penguin (Pygoscelis antarctica)
Dream
2700.0
64
Adelie Penguin (Pygoscelis adeliae)
Biscoe
2850.0
58
Adelie Penguin (Pygoscelis adeliae)
Biscoe
2850.0
116
Adelie Penguin (Pygoscelis adeliae)
Torgersen
2900.0
98
Adelie Penguin (Pygoscelis adeliae)
Dream
2900.0
...
...
...
...
269
Gentoo penguin (Pygoscelis papua)
Biscoe
6000.0
185
Gentoo penguin (Pygoscelis papua)
Biscoe
6050.0
169
Gentoo penguin (Pygoscelis papua)
Biscoe
6300.0
3
Adelie Penguin (Pygoscelis adeliae)
Torgersen
NaN
271
Gentoo penguin (Pygoscelis papua)
Biscoe
NaN
344 rows × 3 columns
Grouping
Grouping is a powerful tool. Let’s first group our penguins by species. The result is a “grouped” object which needs to pass through a summarize operation to be useful.
<pandas.core.groupby.generic.DataFrameGroupBy object at 0x7aca5c487250>
Summarizing
# describe computes basic descriptive statisticspenguins_by_species['Body Mass (g)'].describe()
count
mean
std
min
25%
50%
75%
max
Species
Adelie Penguin (Pygoscelis adeliae)
151.0
3700.662252
458.566126
2850.0
3350.0
3700.0
4000.0
4775.0
Chinstrap penguin (Pygoscelis antarctica)
68.0
3733.088235
384.335081
2700.0
3487.5
3700.0
3950.0
4800.0
Gentoo penguin (Pygoscelis papua)
123.0
5076.016260
504.116237
3950.0
4700.0
5000.0
5500.0
6300.0
# this fails because some columns aren't numericpenguins_by_species.mean(numeric_only=True)
Sample Number
Culmen Length (mm)
Culmen Depth (mm)
Flipper Length (mm)
Body Mass (g)
Delta 15 N (o/oo)
Delta 13 C (o/oo)
Body Mass (kg)
Species
Adelie Penguin (Pygoscelis adeliae)
76.5
38.791391
18.346358
189.953642
3700.662252
8.859733
-25.804194
3.700662
Chinstrap penguin (Pygoscelis antarctica)
34.5
48.833824
18.420588
195.823529
3733.088235
9.356155
-24.546542
3.733088
Gentoo penguin (Pygoscelis papua)
62.5
47.504878
14.982114
217.186992
5076.016260
8.245338
-26.185298
5.076016
penguins_by_species.count()
studyName
Sample Number
Region
Island
Stage
Individual ID
Clutch Completion
Date Egg
Culmen Length (mm)
Culmen Depth (mm)
Flipper Length (mm)
Body Mass (g)
Sex
Delta 15 N (o/oo)
Delta 13 C (o/oo)
SimpleSpecies
Body Mass (kg)
Species
Adelie Penguin (Pygoscelis adeliae)
152
152
152
152
152
152
152
152
151
151
151
151
146
141
141
152
151
Chinstrap penguin (Pygoscelis antarctica)
68
68
68
68
68
68
68
68
68
68
68
68
68
67
68
68
68
Gentoo penguin (Pygoscelis papua)
124
124
124
124
124
124
124
124
123
123
123
123
119
122
122
124
123
MultiIndex
penguins_by_sex_and_species = penguins.groupby(['Sex','Species'])penguins_by_sex_and_species['Body Mass (g)'].describe().round()
/tmp/ipykernel_61635/3464751443.py:1: FutureWarning:

The default of observed=False is deprecated and will be changed to True in a future version of pandas. Pass observed=False to retain current behavior or observed=True to adopt the future default and silence this warning.
count
mean
std
min
25%
50%
75%
max
Sex
Species
FEMALE
Adelie Penguin (Pygoscelis adeliae)
73.0
3369.0
269.0
2850.0
3175.0
3400.0
3550.0
3900.0
Chinstrap penguin (Pygoscelis antarctica)
34.0
3527.0
285.0
2700.0
3362.0
3550.0
3694.0
4150.0
Gentoo penguin (Pygoscelis papua)
58.0
4680.0
282.0
3950.0
4462.0
4700.0
4875.0
5200.0
MALE
Adelie Penguin (Pygoscelis adeliae)
73.0
4043.0
347.0
3325.0
3800.0
4000.0
4300.0
4775.0
Chinstrap penguin (Pygoscelis antarctica)
34.0
3939.0
362.0
3250.0
3731.0
3950.0
4100.0
4800.0
Gentoo penguin (Pygoscelis papua)
61.0
5485.0
313.0
4750.0
5300.0
5500.0
5700.0
6300.0
# pivot tablespenguins_by_sex_and_species['Body Mass (g)'].mean().reset_index().pivot(index='Sex',columns='Species',values='Body Mass (g)')
Species
Adelie Penguin (Pygoscelis adeliae)
Chinstrap penguin (Pygoscelis antarctica)
Gentoo penguin (Pygoscelis papua)
Sex
FEMALE
3368.835616
3527.205882
4679.741379
MALE
4043.493151
3938.970588
5484.836066
Pandas plotting
Some simple plots are available directly from pandas.
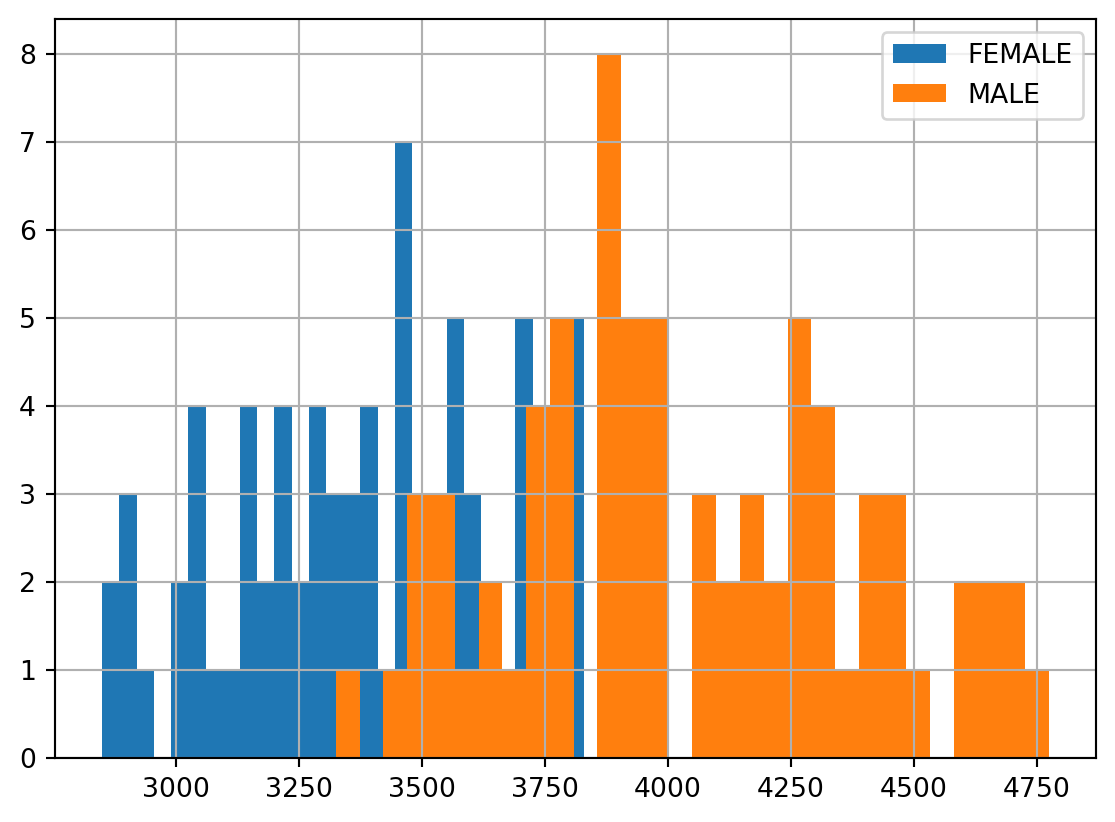
penguins[penguins['Species'].str.startswith("Adel")].groupby(['Sex'])['Body Mass (g)'].hist(bins=30,legend=True)
/tmp/ipykernel_61635/3368902341.py:1: FutureWarning:

The default of observed=False is deprecated and will be changed to True in a future version of pandas. Pass observed=False to retain current behavior or observed=True to adopt the future default and silence this warning.
Sex
FEMALE    Axes(0.125,0.11;0.775x0.77)
MALE      Axes(0.125,0.11;0.775x0.77)
Name: Body Mass (g), dtype: object
Excel files
We can read an excel file. This particular one is complicated for various reasons, including the fact that the column heads are in the third row, not at the top. Also there are a bunch of footnotes starting in row 510 that we don’t want. So we don’t read them in.
Finally, we want to pull out the violent crime numbers for the total area of the state. Notice that Puerto Rico and DC use “Total”, not “State Total”, for Area and so they will be excluded.