Circular Binary Segmentation
Circular Binary Segmentation is an algorithm for finding changepoints in sequential data, and in particular for identifying changes in copy number from CGH or other types of genomic data. The algorithm is described in the 2004 paper Circular Binary segmentation for the analysis of array-based DNA copy number data. It is implemented in the R package DNAcopy, which is widely used in tools for the analysis of copy number in genomics. For example, both the gingko and cnvkit packages ultimately refer the segmentation of the count data that they generate from sequences to to DNAcopy, and thus to the CBS algorithm.
To get a glimpse at how CBS works, consider an array of sequentially organized data (such as read counts in bins along a chromosome):
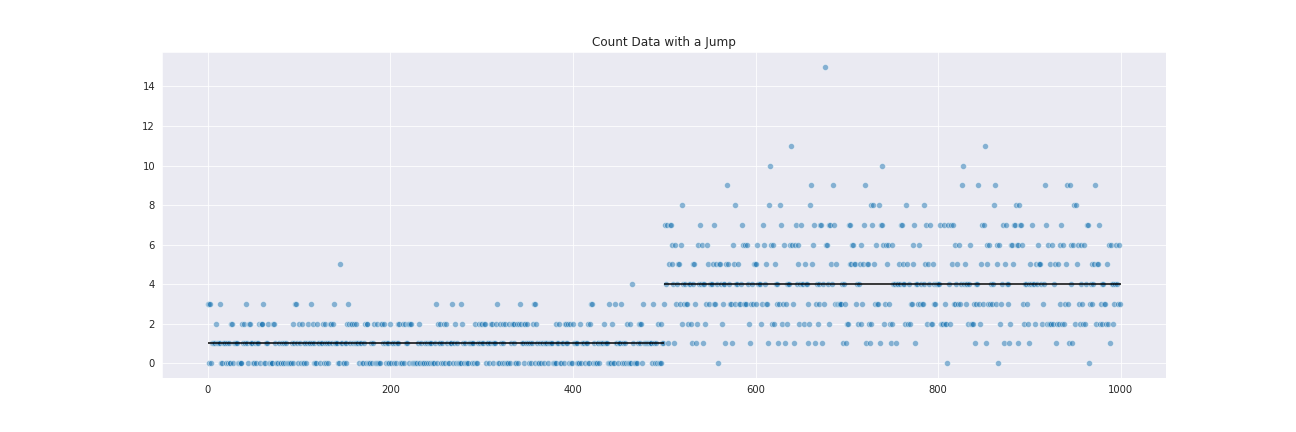
This data was generated from a Poisson distribution, with a mean of 1 changing to a mean of 4 at the jump point.
The original changepoint detection strategy comes from a 1975 paper by Sen and Srivastava in the Annals of Statistics. If $D$ is the array of data, of length $n$, we consider the partial means $\mu_i$ and $\mu_{i}’$ of the first $i$ and last $n-i$ elements of $D$. We locate $i$ such that $|\mu_{i}-\mu_{i}’|$ is maximal and we apply a $t$-test to determine if this difference is significant. If so, we mark this as a change point.
The CBS algorithm takes the same general approach. However, instead of considering a single changepoint in the middle of an interval, the CBS algorithm imagines that the data is wrapped into a circle and it considers partitions of the data into two arcs with the first running, say, from $i$ to $j$ and with the second running from $j$ to $n$ to $0$ and back to $i$. To apply the algorithm, one finds $i$ and $j$ so that the t-statistic for the difference in means between the ‘inside arc’ from $i$ to $j$ and ‘outside arc’ from $j$ to $n$ and from $0$ to $i$ is maximal. If this $t$-statistic is significant, then one pronounces the interval as a change. To continue, one then recursively applies the algorithm to the three resulting segments: from $0$ to $i$; from $i$ to $j$, and from $j$ to $n$ until no further breaks are found.
An implementation of this algorithm is available in this repository. This is not a full implementation of the algorithm described in the CBS paper. It does share a few techniques:
-
To avoid strong hypotheses on the structure of the data, we use a kind of bootstrapping to determine whether a “t-statistic” is significant. Namely, after computing the t-statistic for in interval from i to j in the array x of length n, we randomly shuffle the data in x some number of times (say 1000) and compute the t-statistics of the interval from i to j for this random data. If the measured statistic lies in the 95th percentile of the shuffled data, we declare it significant.
-
After finding a partition $i_0, i_1, \ldots, i_n$ of $x$ using the circular method, we go back and apply the original test for a single partition to each triple $i_r, i_{r+1}, i_{r+2}$ to further confirm that $i_{r+1}$ is in fact a break point. If not, we drop it. We use the same comparison against shuffled data to test for significance as in the original binary case.
We do not use the “block based” algorithm described in the original paper. In fact, it’s not clear to me that that method is really necessary any more; it was introduced to improve performance but given the speed gains in computers since 2004 it may not be worth the overhead.
