Bernoulli Mixture
Bernoulli Mixture following Bishop’s Pattern Recognition and Machine Learning Section 9.3.3.
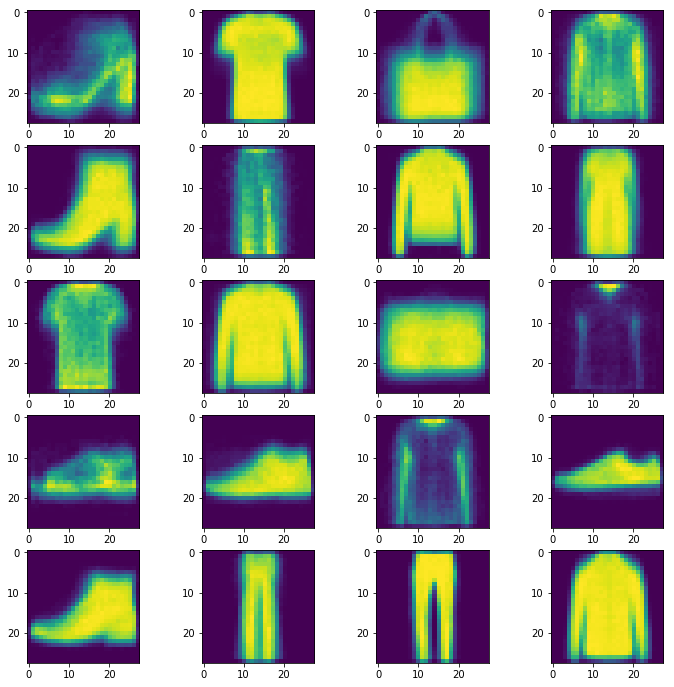
The code below gives a basic implementation of the Bernoulli Mixture fit using the EM algorithm. The essential equations are 9.57 and 9.58 in Bishop. We apply it to the fashion-mnist dataset which has 10 classes, but we look for 20 classes and pick up variations among the purses, etc. The resulting figure is basically a version of Figure 9.10 in Bishop. Different runs of this code produce different results!
# %load bernoulli.py
import pandas as pd
import numpy as np
from numpy import log
from scipy.special import logsumexp
import matplotlib
import matplotlib.pyplot as plt
from itertools import product

class BernoulliMixture:

    def __init__(self, n_clusters=2, n_iter=100, tolerance=1e-8, alpha1=1e-6, alpha2=1e-6):
        '''sets things up'''
        self._n_clusters = n_clusters
        self._n_iter = n_iter
        self._tolerance = tolerance
        self._alpha1 = alpha1
        self._alpha2 = alpha2
        self.Theta = 1/self._n_clusters*np.ones(self._n_clusters)

    def _P(self, x, Mu, Theta):
        '''computes the log of the conditional probability of the latent variable given the data and Mu, Theta'''
        ll = np.dot(x,log(Mu))+np.dot(1-x,log(1-Mu))
        Z = (log(Theta)+ ll - logsumexp(ll+log(Theta), axis=1, keepdims=True))
        return Z

    def fit(self, data):
        '''carries out the EM iteration'''
        self._n_samples, self._n_features = data.shape
        self.Mu = np.random.uniform(.25, .75, size=self._n_clusters*self._n_features).reshape(self._n_features, self._n_clusters)
        N = self._n_samples

        for i in range(self._n_iter):
            V = np.exp(self._P(data, self.Mu, self.Theta))
            W = V/V.sum(axis=1,keepdims=True)
            R = np.dot(data.transpose(), W)
            Q = np.sum(W, axis=0, keepdims=True)
            self._old = self.Theta
            self.Mu, self.Theta = (R + self._alpha1)/(Q + self._n_features*self._alpha1), (Q + self._alpha2)/(N + self._n_clusters * self._alpha2)
            if np.allclose(self._old, self.Theta):
                return

    def predict_proba(self, data):
        '''computes the conditional probability giving cluster membership'''
        return np.exp(self._P(data, self.Mu, self.Theta))

    def generate(self):
        '''generates data from the distribution'''
        x = np.random.multinomial(1,self.Theta.ravel())
        z = np.dot(np.random.binomial(1, self.Mu),self.Theta.transpose())
        return z

if __name__ == "__main__":
    data_df = pd.read_csv('data/fashion-mnist_train.csv',nrows=5000)
    data = data_df.iloc[:,1:].values
    data = data // 128
    M = BernoulliMixture(n_clusters=20)
    M.fit(data)
    fig, ax = plt.subplots(5,4)
    fig.set_size_inches(12,12)
    for i,j in product(range(5), range(4)):
        if 4*i+j<20:
            ax[i,j].imshow(M.Mu[:, 4*i+j].reshape(28,28))
        else:
            ax[i,j].axis('off')
    fig.savefig('trial.png')
